How is data work organized?

•August 13, 2018 • Leave a Comment

DOWNLOAD HERE — Work of Data Literature Review

As part of the Work of Data project here at Intel, Ian Lowrie had a look at what the literature says about the social organization of data work–not just data science, but full systems that collect and parse data on an ongoing basis (think, Internet of Things or self-driving cars.) There’s a heady mix of organizational factors, professional socialization, regulation, and beliefs about software production methods and systems architecture. Perhaps the most surprising thing is just how rare it is that folks working in these arenas think of themselves as data scientists! We weren’t that interested in social media data systems, or business informatics, so maybe that explains it.

Next post is a visualization of Lowrie’s working paper. Stay tuned!

What is Data Sense?

•January 29, 2016 • Leave a Comment

Better explained in video than words…

Data Literacy and Why it Matters

•January 25, 2016 • Leave a Comment

Also found this video, which records my opening remarks for Quantified Health Public Health Symposium. Embarrassingly, I seem to be wearing the exact same sweater as the Tracking Food talk (perhaps it’s my talk-giving sweater? My neutral, it’s sort of dressy but still on the West Coast sweater?)

Perhaps more importantly, here I’m trying to think through what “data literacy” might mean, and the kind of trouble we might find ourselves in if we presume it to be straightforward STEM-as-usual. I argued that a widespread data literacy will–and should–make it possible for more people to ask the kinds of questions that make experts uncomfortable, and that getting good at being uncomfortable is perhaps the best thing we “experts” can do to increase access to data.

Tracking Food

•January 25, 2016 • Leave a Comment

I’ve only just discovered that QS has been helpfully uploading videos onto Vimeo. I found one where I  talk about the participant part of participant observation (I’ve been doing research on Quantified Self).  I tried to reflect on my own food tracking practices through the lens of anthropology. Although I don’t remember saying so explicitly, I use the work of Helen Verran and Jane Guyer to unpack how these numbers are generating meaning, beyond the obvious “is it factually true or not.”

Mapping Data Access

•June 26, 2014 • Leave a Comment

Here’s some work I did with Robin Barooah and Quantified Self Labs to explore what it is the public needs to know about how data gets shipped around between various services and devices.

 http://quantifiedself.com/2014/06/qseu14-breakout-mapping-data-access/

After doing some initial prototyping of mapping points of data access, we asked folks to draw a picture of where they thought their data actually went, or could go. We learned a ton about what their actual concerns were, which, it turned out, went well beyond the usual surveillance issues.


Data Stories

•June 25, 2014 • Leave a Comment

A while ago, my friend Laura Watts and I produced a short work of creative non-fiction. Laura is both an academic and a poet– a combination I find deeply admirable.  We worked together with artist and poet Alistair Peebles, and print artists Rachel Barron and Nathan Clydesdale to weave the words together with images in a more intensive way.  We took creative license with the notion of a map, and made a series of ethnographic/visual moments concerning the physical and social realities of data.


DataStories_sand14

An excerpt:

‘Big Data’ rises and accumulates today from so much of our activity, off and online, that our lives seem almost suffused by ‘The Cloud’. But perhaps data might be otherwise? In this collection, Laura Watts and Dawn Nafus, two ethnographers, bring together stories from different data sites: from the marine energy industry, and from the Quantified Self movement. These Data Stories speak, not of clouds, but of transformations: in things, in energy, and in experience.


These are small booklets, handcrafted in Scotland, which you can order online. If you have any trouble I still have a few left.

Making Progress…

•June 3, 2014 • Leave a Comment

A short video about what I’ve been up to. If you are interested in what we are building you can sign up at http://www.makesenseofdata.com.

What I learned by making

•November 21, 2013 • Leave a Comment

Unusually for me, I’ve been heads down in a single project of late.  A tool. An actual piece of software that I hope might actually be useful to someone.  Not comment, not analysis, but a tool.

I’ve been hanging out in the Quantified Self world for a little while now.  I hang out both as a scholar, and as a part of Intel’s extended  effort to understand the “data economy”.  In this project, we’ve been asking what kind of openness should exist if data is going to circulate in ways that actually benefited  people.  “People” as in the breathing kind, not the kind invented by legal fiat.  There’s a lot of talk in the QS world about facilitating data openness and sharing, and people have various views on what that could look like.  Even just getting data out of a service into a standard format  is still a huge challenge.  But what I learned after spending time with the community is that there is a more fundamental piece still missing, something that has to happen even before we can imagine what could be useful about data sharing—namely, the stuff has to make sense.  If you don’t have data that actually makes sense, you don’t really have anything to share.  Something personally meaningful  is not going to magically emerge from plonking data into a giant pot and hoping the correlations aren’t spurious.  (Something may in fact emerge from the giant pot strategy, but my point is that it takes more than just making a pot.)

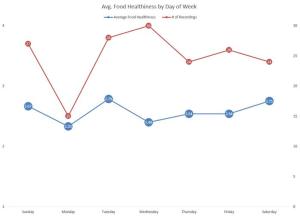
When I did my own show and tell talk at a local QS meetup, I learned first hand the invisible labor it takes to really get insight out of data.  Behind the scenes, many talks involve some serious hours, coding skills and good statistical knowledge.  I’m not entirely new to the old spreadsheet, but I’m neither a math person nor a visualization person.  Frankly, I had to ask for help.  Help came in the form of the patience-of-saint Steven Jonas, the Portland QS organizer who not only made my bad Excel charts into something compelling, but suggested new kinds of calculations that I did not think to do.  He suggested I bin my “meal healthiness” scores according to day of week.  It looked something like this:

food healthiness by week

This turned out to be hugely significant for me.  I could spot immediately my partner’s teaching schedule, and how that had an effect on my propensity to eat out, and therefore the healthiness of my meals.  The amazing thing was, the calculation Steven did was one of the very calculations that we have been building into the tool (“we” really being the computer scientists and designers—I just make sure the ship remains pointed in an ethnographically-sound direction).   Seeing my data in this way caught me off guard. For literally the past three months I had been banging on about how important it is to be able to pick out temporal cycles in any dataset, and how hard it is to do that for people without data wizarding skills. So it’s not like I wasn’t sensitized to this form of analysis.  I knew it existed, and that it was possible.  In fact, it was front and center on my radar.  I even knew multiple people who might be kind enough to show me how to do it if I asked.  But I didn’t even think to ask.  I just didn’t think in those terms, because it wasn’t part of the tools that I saw as at my disposal. Without the tools at the ready, it wasn’t possible for me.

Thankfully there are others who are also helping to make data much easier to work with—Datafist, Fluxstream, Tictrac, Project AddApp, ManyEyes, etc..  In fact, we collaborated with Evan Savage in making our own contribution.   All of these tools take various approaches, and we have our own.   Ours is to try to help people make the most what they already know about their personal context to make sense of their data.  This means providing space for qualitative annotations, offering data processing techniques in ways that map to human experiences, not the underlying mathematical function  (“show me some temporal cycles” not “make a histogram”), and making it possible to edit data out.  If that holiday you took is artificially skewing things, you should be able to just get rid of it for the purposes of calculating an average.  That’s not “cheating,” that’s making sense of a daily routine.  You can also just look for patterns in missing data, if there’s some signal in there for you.    Frustratingly, there’s not yet a name.

We’re not done yet—a beta version is targeted for early 2014– but I can definitely say I learned some things, perhaps the most powerful of which was that knowing  things in the abstract (“temporal cycles really matter!”) is very different from doing it at a personal level.  Steven’s willingness to share with me his data skills in turn gave me something more meaningful to share.  I also re-ignited my commitment to the “participant” side of participant observation.  Getting stuck in to the building process has been an amazing anthropological adventure,  though I’ll save that for another post.  I’m even slowly making peace with the correlation—that statistical trick used for the last few hundred years as an epistemological trump card to beat up other forms of knowledge making.  I’m learning from the computer scientists that there’s more you can do with correlation than just declare victory.  Perhaps correlation doesn’t just have to be for the purpose of making scientific generalizations, the importance of which is highly controversial in QS.  With more granular ways of playing with data, could correlation be reclaimed as a way to make matters of concern rather than matters of fact?  One way or another, we’ll find out.

Speaking of finding things out for yourself, if you want to be one of our beta testers, or just have an opinion on the name, send me a note using the below form and I’ll make sure you are included.

The Quantified Self Movement is not a Kleenex

•March 15, 2013 • Leave a Comment

(Note: Jamie Sherman and I wrote this text together as an experiment in mixing academic and popular writing styles. It’s still a prototype.)

The Quantified Self (QS) is a global movement of people who numerically track their bodies.  If you were to read popular press accounts like this, this and this, you could be forgiven for thinking that it was a self-absorbed technical elite who used arsenals of gadgets to enact a kind of self-imposed panopticon, generating data for data’s sake. Articles like this could easily make us believe that this group unquestioningly accepts the authority of numerical data in all circumstances (a myth nicely debunked here). Kanyi Maqubela sees a lack of diversity in “the quantified self.”  On one hand, he is absolutely right to say that developing technologies to get upper middle class people who do yoga and shop at farmers markets to “control their behavior” is a spectacular misrecognition of the actual social problem at hand,[1] and one that can be attributed directly to the design-for-me methodology[2] so rampant in Silicon Valley.  The charge works, however, only if we think about Quantified Self as if it were analogous to Kleenex:[3] a brand name that can be used generically for the latest round of health and fitness gadgets technologies whose social significance (or lack thereof) is self-evident.

The Quantified Self that we have come to know is not a Kleenex. It is a particular social movement with specific social dynamics, people and practices.  Even the most cursory ethnographic examination of actual practices of its members reveals a very different picture.  We have been conducting this research for the past year and a half, alongside many other academics who have also been welcomed into the community. The Quantified Self that we know has very little to do with trying to control other people’s body size or fetishizing technology. Indeed, people who create data with pen and paper are community leaders alongside professional data analysts.  As a social movement, QS maintains a big tent policy, such that the health care technology companies who indeed would like to control other people’s body sizes do participate. But QS also organizes its communities in ways that require people to participate as individuals with personal experiences, not as companies with a demo to sell.  This relentless focus on the self we suspect does have cultural roots in neoliberalism and the practices of responsibilization Giddens identified so long ago, but it also does important cultural work in the context of big data.

An example from our ethnography can illustrate this.  At a recent Quantified Self meeting on the West Coast, discussion turned to “habit formation.” Sean, one of the organizers of the group, was talking about his frustration with tracking apps organized around “streaks.” He felt great to have kept his new “habit” seventy times in a row, but “when your mother gets ill and you miss a week, poof! It’s gone.” He was looking for something that would offer a metric for what he called the “strength” of a habit as he felt that would be much more encouraging for him. After all, the habit does not just go away  because the data does.  Other participants mentioned various kinds of moving averages that would be nice, and the conversation wandered into a debate over whether “habits” was a negative framework to use, and whether “practices” were more constructive. Later in the evening, two men, David and Tom, were talking about Tom’s recent purchase of a Jawbone Up—one of many devices on the market that will track movements and infer various things from them, like sleep or exercise. Tom showed us the visualization of his sleep data that appeared to show that he falls asleep quite quickly most nights. That information was encouraging as he had been concerned about his sleep. While he was not entirely certain how the bracelet-style device measured sleep cycles, he conjectured that it must have to do with motion. In any case, he felt like he was more rested just knowing that “in fact” he was sleeping well. The group laughed, and then continued to wonder collectively about just how the thing “decided” what sleep cycle you were in. Discussion turned to other devices that incorporated other indicators like skin temperature, perspiration, heart rate and brainwaves. A certain watch had all the sensors David wanted. He could use it for more than just sleep tracking,  but it had limits.  He knew the watch could track his heart rate, but he wanted to see the variability of his heart rate because he had been curious about the physical expression of moods. The watch only gave a pulse, as if there were no other interpretation of the underlying signals from the heart.

The relationship between “habit formation” and the limitations of devices is significant. On one hand, the habits/practices that most participants sought to instill in themselves generally (though not always) adhered to normative guidelines around health and good citizenship: exercise more, work more effectively, keep moods elevated, etc.. On the other hand, these clearly are not passive consumers swallowing blindly the parameters of “what’s good for them.” In many ways they see their activities as a response to big data and big science dictums that make claims about the healthy body from on high. In the face of generalized, anonymous one-size-fits-all prescriptions derived from population studies, they seek to understand what is right for me. What is the optimal bedtime for me? Under what diet regime do I feel my best? What activities (sleep, caffeine, wheat, dairy, and other usual suspects) are particularly correlated with mood or energy in my life?

If people in this movement appear narcissistic, it is because of their focus on the self.  The insistence on the agency of each person to track, understand, and decide for themselves what is right “for them” does draw on cultural threads of individualism, but they do it in ways that refrain from making assumptions about what is right for others. The self is the site of internalization of dominant big data visions that do control people in Foucauldian, biopolitical ways,[4] but it is also, at the same time, a means of resistance. QSers self-track in an effort to re-assert dominion over their bodies by taking control of the data that many of us produce simply by being part of a digitally interconnected world.  When participants cycle through multiple devices, it is often not because they fetishize the technology, but because they have a more expansive, emergent notion of the self that does not settle easily into the assumptions built into any single measurement.  They do this using the technical tools available, but critically rather than blindly.  It is not radical to be sure, but a soft resistance, one that draws on and participates in the cultural resources available.

The eagerness with which pundits seize on the Quantified Self as a generic brand, a Kleenex style term to toss around, speaks to the ways that QS practices cohere with current ideologies and practices of self in the mainstream. Yet to stop there, to overlook the particulars of what actual QSers do, how they do it and why, is to miss the social significance of the Quantified Self as a movement. It is not the nerdy devices they enthuse over, nor the sometimes mundane kinds of self-transformations they seek to achieve, but rather the explicitness and with which they confront the question of what the cultural dominance of data means for me.   Answering this question requires a critical and questioning point of view.   Within the Quantified Self, like snowflakes, no two tissues are alike: now, how do we count that?


[1] Greenhalgh, S. 2012. “Weighty Subjects: The Biopolitics of the U.S. War on Fat.” American Ethnologist, 39:3, pp. 471-487

[2] Oudshoorn, N., Rommes, E., & Stienstra, M. 2004. Configuring the user as everybody: Gender and design cultures in information and communication technologies. Science Technology Human Values, 29(1), 30-63

[3] Ken anderson pointed out the Kleenex comparison to us.

[4] Cheney-Lippold, J. 2011. A new algorithmic Identity : Soft biopolitics and the modulation of control. Theory, Culture & Society, 28, 164-181.

Some new blog posts–elsewhere

•March 11, 2013 • Leave a Comment

If you have arrived here and see the big gap between this post and the last one in, say, 2010, you’ll see my blogging habit is at best sporadic. But I have been over at Culture Digitally, talking about the ethnomathematics of algorithms and also debating my work on open source.

I’ve just updated the publications page–there’s some new work there that will give you some indication of what I’ve been up to.